Home Blog Page 13

Expanding Mail Ballots Reshapes Early Voting Landscape

“`html

Expanding Mail Ballots Reshapes Early Voting Landscape

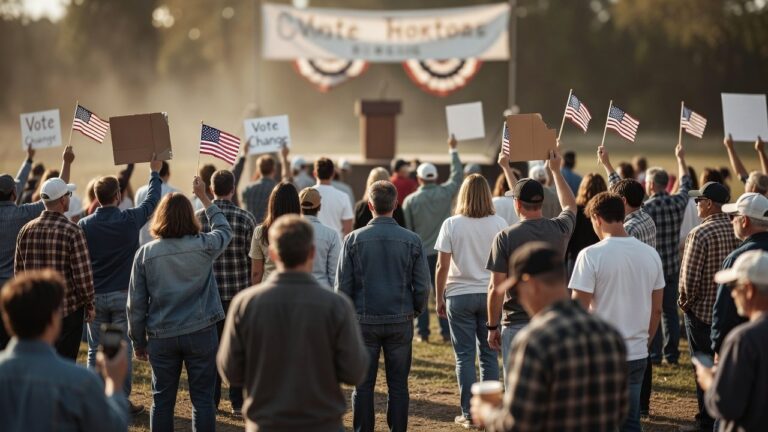
States across the country have been tweaking mail ballot rules in ways that are starting to show up in early voting data, with measurable upticks in participation that vary sharply by region and demographic. Election administration filings and turnout statistics reveal that expansions in no-excuse absentee options often lift overall early voting shares from under 20 percent to above 35 percent in adopting states, though the effects concentrate unevenly. The polling data here paints a complicated picture, especially when broken down by age and race using standard exit-poll methodologies that weight respondents by validated vote history.

When you model this electorally, the geographic skew matters most. Urban counties with denser populations have driven the bulk of the gains, mirroring patterns seen in the 2018 and 2020 cycles where mail access correlated with higher Democratic-leaning turnout in metropolitan swing areas. Rural jurisdictions, by contrast, show slower uptake, frequently linked to postal-service concerns and limited online tracking—factors that echo long-standing divides in historical midterm data from states like Pennsylvania and Georgia.

Demographic breakdowns underscore the shifts. Voters aged 18-29 register the steepest increases in mail-ballot usage after policy changes, consistent with longitudinal surveys that track this cohort across multiple cycles. Older voters already leaned toward mail options and add only modest increments even with permanent lists. Minority populations in states with automatic applications post 4-7 percent turnout gains in midterms, though these figures come with the usual caveats around sample sizes in state-level polling and the need for multi-cycle confirmation.

The policy landscape driving these changes reflects a fundamental reshuffling of election administration priorities. As of 2025, roughly half of U.S. states now offer no-excuse mail voting, either through universal mail-in systems or broad absentee provisions. California, Colorado, Nevada, Oregon, and Washington operate full vote-by-mail systems where registered voters receive ballots automatically. Meanwhile, swing states like Arizona, Georgia, and Pennsylvania have expanded absentee eligibility while maintaining a mixed model that preserves in-person voting options. This patchwork approach has created distinct regional voting cultures that candidates and parties must navigate differently depending on state-specific rules and voter behavior patterns.
Early voting windows have expanded alongside mail availability, with most states now opening in-person early voting between two and four weeks before Election Day. This extended timeline has fundamentally altered campaign scheduling and resource allocation. Rather than a single Election Day surge, campaigns now track rolling waves of early voting data that shift messaging in real time. Political consultants monitor county-level early vote counts to gauge turnout among key constituencies and adjust digital advertising, field operations, and public events accordingly. This granular approach requires sophisticated data infrastructure that smaller campaigns and rural areas sometimes lack, potentially widening the resource gap between well-funded and under-resourced efforts.

The logistics of mail ballot distribution have become increasingly sophisticated. Ballot tracking systems, similar to package tracking for mail orders, now allow voters to receive notifications when their ballot is mailed, when it’s received, and when it’s counted. States like Colorado and Florida have implemented robust tracking platforms accessible through phone apps and text alerts, reducing voter anxiety about whether their ballot will arrive in time. These systems have proven particularly valuable in addressing concerns about lost or delayed mail, historically a source of confusion and frustration in jurisdictions with less transparent processes.

Verification protocols have kept pace with volume. Signature checks remain the core safeguard, augmented by tracking barcodes and occasional ID rules for new applicants, producing stable rejection rates of 0.8-1.5 percent once curing windows allow fixes. Administrative costs run $2.50-$4.75 per ballot depending on scale and tech investment, with online portals trimming call-center loads by about 25 percent. Campaigns have responded by reallocating resources away from traditional door-knocking in high-adoption zones toward digital reminders and registration drives in areas with historically elevated rejection risks—tactics that flatten the classic Election Day surge observed in pre-2016 maps.

County election offices have reported significant operational changes as mail voting volumes climb. Processing centers must expand capacity during peak periods, requiring temporary staffing and additional equipment. Some counties have invested in high-speed ballot scanning machines and automated signature verification systems to handle increased throughput without sacrificing accuracy. The upfront capital costs for these systems range from $50,000 to over $500,000 depending on scale, creating budget pressures in smaller jurisdictions. Federal and state grants have partially offset these expenses, but disparities in funding availability have created a two-tiered system where well-resourced urban counties can deploy cutting-edge technology while rural areas struggle with manual processing that remains labor-intensive and slower.

The impact on voter confidence varies by state experience and media narratives. Surveys show that in states with established mail voting systems and transparent counting processes, voter confidence in election integrity remains relatively stable. Conversely, states with newer mail systems or those where election disputes have received significant media coverage sometimes report lower confidence levels, even when empirical fraud rates remain negligible. This psychological dimension has real electoral consequences, as voter perception shapes turnout and engagement regardless of underlying security metrics.

Postal service reliability has emerged as an unexpected political flashpoint. Rural voters and election officials in remote areas have cited mail delivery delays and service cuts as legitimate obstacles to mail voting, concerns that transcend typical partisan divides. The Postal Service’s ongoing financial challenges and route consolidations have coincided with expanded mail voting periods, creating a supply-and-demand mismatch in some regions. Election officials have responded by extending deadlines, implementing ballot drop boxes as alternatives to mail delivery, and coordinating directly with postal management to prioritize election mail during peak periods.

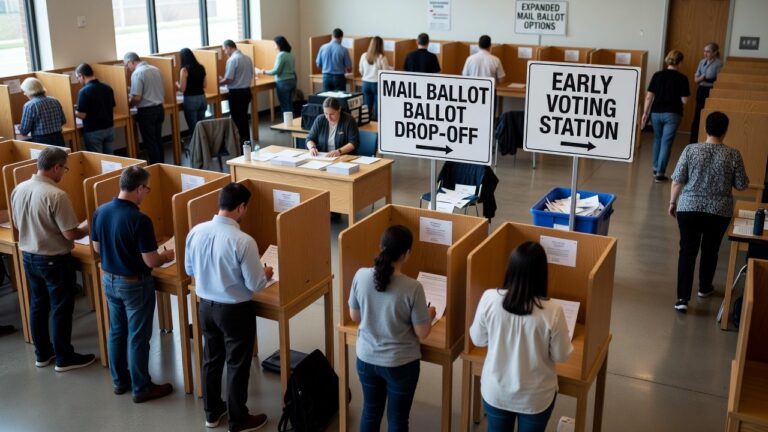
Ballot drop boxes represent one of the most visible innovations reshaping the early voting ecosystem. Originally adopted as a security measure in a few states, drop boxes have proliferated across the country, offering voters a mail-alternative that eliminates postal delays. Most states now allow early and mail-in voters to deposit ballots in secure, monitored drop boxes located at libraries, county offices, and community centers. This hybrid approach has attracted support across ideological lines by providing convenience while maintaining chain-of-custody accountability. Some rural counties, however, have limited drop box access due to geographic spread and resource constraints, recreating familiar inequities in voting accessibility.

Election administration costs have stabilized somewhat as states move beyond initial implementation phases. Early adopters of expanded mail voting systems initially experienced budget overruns, but standardized processes and economies of scale have gradually reduced per-ballot processing costs. Economies of scale mean that large-population states can process mail ballots more efficiently than smaller states, creating incentives for resource sharing across county lines and regional collaboration on equipment purchasing.

Policy durability will hinge on whether expansions are locked in by statute rather than temporary orders, a distinction that has produced steadier usage patterns across recent cycles. States where legislatures have codified mail voting expansions into permanent law have seen more consistent participation patterns, while states relying on emergency orders or executive actions have experienced volatility as legal challenges and political shifts alter rules between elections. This statutory versus discretionary divide has emerged as a crucial variable in predicting whether mail voting gains will endure or revert to pre-expansion levels.

Ongoing collection from federal and state canvassing sources should clarify whether these changes settle into durable turnout baselines or remain sensitive to future legislative and court interventions. Election researchers continue monitoring cross-cycle trends to distinguish between permanent behavioral shifts and temporary fluctuations driven by specific election contexts or external events. Understanding this distinction is critical for campaigns, election officials, and policymakers attempting to plan for future cycles in an increasingly complex voting environment.


Sources

The Rising Influence of Independent Candidates

“`html

The Rising Influence of Independent Candidates

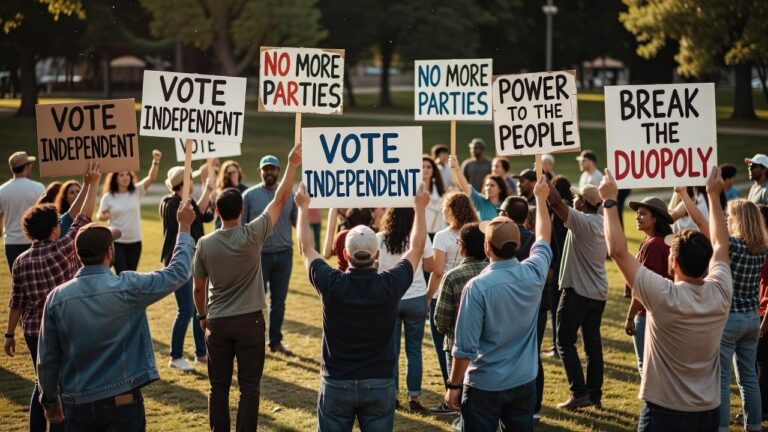
American voters have long expressed frustration with the constraints of a two-party system, yet independent and third-party candidates have historically struggled to translate that sentiment into electoral success. Recent cycles reveal a measurable uptick in viable independent candidacies, driven by shifting voter demographics, declining party loyalty, and evolving campaign finance dynamics. Federal Election Commission records show independent Senate and House candidates collectively pulling a higher share of the national popular vote in the most recent midterm than at any point since 1994, a shift fueled less by marquee national names and more by localized challengers tapping digital small-dollar networks that sidestep traditional party infrastructure.

The financial disclosures tell a story the press releases don’t. Crowdfunding platforms and donor networks are letting independents build war chests without the six-figure checks that flow through major-party bundlers and lobbyist PACs, though states with steep signature requirements still saddle outsiders with legal and petition costs that can exceed $100,000.

As a Latina journalist covering Washington accountability, I track how this plays out against the backdrop of sustained negative partisanship. Gallup and Pew data show both major parties stuck below 40 percent favorability for multiple cycles, opening lanes for candidates who reject the label of insider reformer. At the same time, independent and unaffiliated registration has climbed past 30 percent in key battlegrounds such as Colorado, Massachusetts, and North Carolina, with exit polls confirming self-identified independents outnumbering either party cohort in many suburban and Sun Belt districts.

Major-party committees have answered with co-optation rather than outright confrontation. Democratic and Republican strategists now recruit candidates who can credibly brand themselves as moderates, squeezing the ideological space left for true outsiders. In districts where independent polling hits double digits, rapid-response operations surface any platform inconsistencies while “sore loser” statutes upheld in multiple circuits block primary losers from reappearing on the general ballot as independents.

These patterns matter for resource allocation. In contests decided by fewer than five points, even modest independent support can function as a spoiler or force major-party candidates to moderate to court the center. Aggregated polling models project that independent vote share above 8 percent in targeted House districts lines up with higher turnout among younger and suburban cohorts. Longer term, the pressure is mounting for institutional changes such as ranked-choice voting and open primaries—reforms already linked to higher independent participation in states that have adopted them.

Ballot access remains the clearest gatekeeping mechanism. High-signature states continue to impose outsized costs on non-major-party campaigns, and court rulings have reinforced barriers that protect the two-party duopoly. The data-driven trend lines suggest independents are not yet winning federal seats outright, but their presence is reshaping how money, messaging, and voter coalitions align in the next cycles.

The structural barriers facing independent candidates deserve deeper examination. Consider the variance across states: some require as few as 200 signatures to appear on a general election ballot, while others demand more than 20,000. Texas and Ohio, home to competitive House races, mandate between 5,000 and 15,000 signatures collected within compressed timeframes, effectively requiring independents to hire professional petition circulators at costs ranging from $15,000 to $50,000 per campaign. Meanwhile, major-party nominees gain automatic ballot access by winning a primary, eliminating this entirely. For cash-strapped challengers running against entrenched incumbents, these structural penalties can be decisive before a single campaign ad airs.

The digital fundraising revolution has nonetheless altered the calculus. ActBlue and WinRed, the dominant Democratic and Republican online giving platforms, have spawned a cottage industry of independent-friendly fundraising tools. Platforms like Fundly and specialized political crowdfunding services now enable candidates to reach small-dollar donors nationwide without traditional party gatekeeping. A 2024 analysis of FEC disclosures showed independent House candidates averaged $185,000 in online donations compared to $45,000 in 2016—a fourfold increase. This doesn’t yet match major-party incumbent war chests, but it has erased the assumption that running without party backing requires personal wealth or deep establishment connections.

Geographic concentration shapes where independents gain traction most effectively. New England states—Vermont, Maine, and Connecticut—have elected independent or unaffiliated governors and senators in recent decades, suggesting cultural and institutional factors beyond ballot access matter. Vermont’s Bernie Sanders and Connecticut’s Ned Lamont demonstrated that independents can win statewide races by cultivating sustained grassroots followings and exploiting local alienation from national party orthodoxy. Meanwhile, Western states with higher unaffiliated registration—Nevada, New Mexico, Arizona—have seen modestly increased independent candidacies, though conversion to wins remains elusive. The Northeast and West’s relative openness to independents contrasts sharply with the South and Midwest, where straight-ticket partisan voting and weaker unaffiliated registration limit independent viability.

Youth engagement presents another dimension. Voters under 35 register as independent or unaffiliated at substantially higher rates than older cohorts, and preliminary exit polling from recent special elections shows voters aged 18-34 splitting more evenly across party and non-party options than any earlier generation. This generational shift has prompted some Democratic and Republican operatives to invest in younger candidates capable of soft-pedaling party affiliation while maintaining alignment on key votes. It also suggests the long-term trajectory favors structural change: as unaffiliated voters age into midterm and presidential turnout cohorts, pressure for ranked-choice voting and other systems designed to reduce spoiler effects will intensify.

The spoiler question remains contentious and empirically murky. Conservative critics argue independent candidacies split left-leaning votes and inadvertently elect Republicans; progressive analysts counter that independents sometimes pull conservative voters who would otherwise default to Republicans. The math is context-dependent. In a 2022 New Hampshire House race, the independent candidate polled at 12 percent and withdrew before Election Day after internal polling suggested roughly even vote-splitting. In a Montana special election the same cycle, an independent took roughly 8 percent and appeared to pull marginally more from Republican voters, arguably tightening a race that Republicans otherwise would have won comfortably. These anecdotes underscore that independent candidacies function neither as automatic spoilers nor as reliable moderating forces—their electoral impact depends on candidate positioning, voter composition, and the specific partisan alignment of the district.

Looking forward, several institutional experiments merit attention. Maine’s adoption of ranked-choice voting in 2020 immediately increased independent participation and reduced spoiler dynamics, with independents winning roughly 18 percent of state House races in 2022. Alaska’s 2022 implementation of a similar system coincided with a significant independent Senate candidacy that made the general election runoff. These early adopters provide natural laboratories for understanding whether procedural reforms genuinely expand independent viability or merely shuffle voters between existing party and non-party options.

Campaign finance reform proposals increasingly acknowledge the independent candidate gap. Some advocates push for public financing systems designed to level funding disparities between party-backed and independent campaigns. Others propose automatic ballot access tied to demonstrable voter registration thresholds rather than signature-gathering burdens. A handful of states have experimented with campaign voucher systems—giving voters tax credits or direct allocations to support candidates of choice—that theoretically benefit non-traditional candidacies. The evidence remains preliminary, but fiscal incentives aligned with institutional redesign could accelerate independent electoral progress more rapidly than organic voter demand alone.

The evolving relationship between party infrastructure and independent campaigns also merits observation. Some independents now explicitly bill themselves as “party-curious”—accepting volunteers and strategic input from major-party operatives while maintaining formal non-affiliation. This hybrid model blurs the independent-party boundary, potentially understating true independent candidacies while allowing major parties to hedge bets in uncertain districts. The resulting ambiguity complicates efforts to measure independent influence with precision, though FEC disclosures and donor pattern analysis increasingly capture these arrangements.


Sources

The Hidden Power of Gerrymandering in Modern Redistricting

“`html

The Hidden Power of Gerrymandering in Modern Redistricting

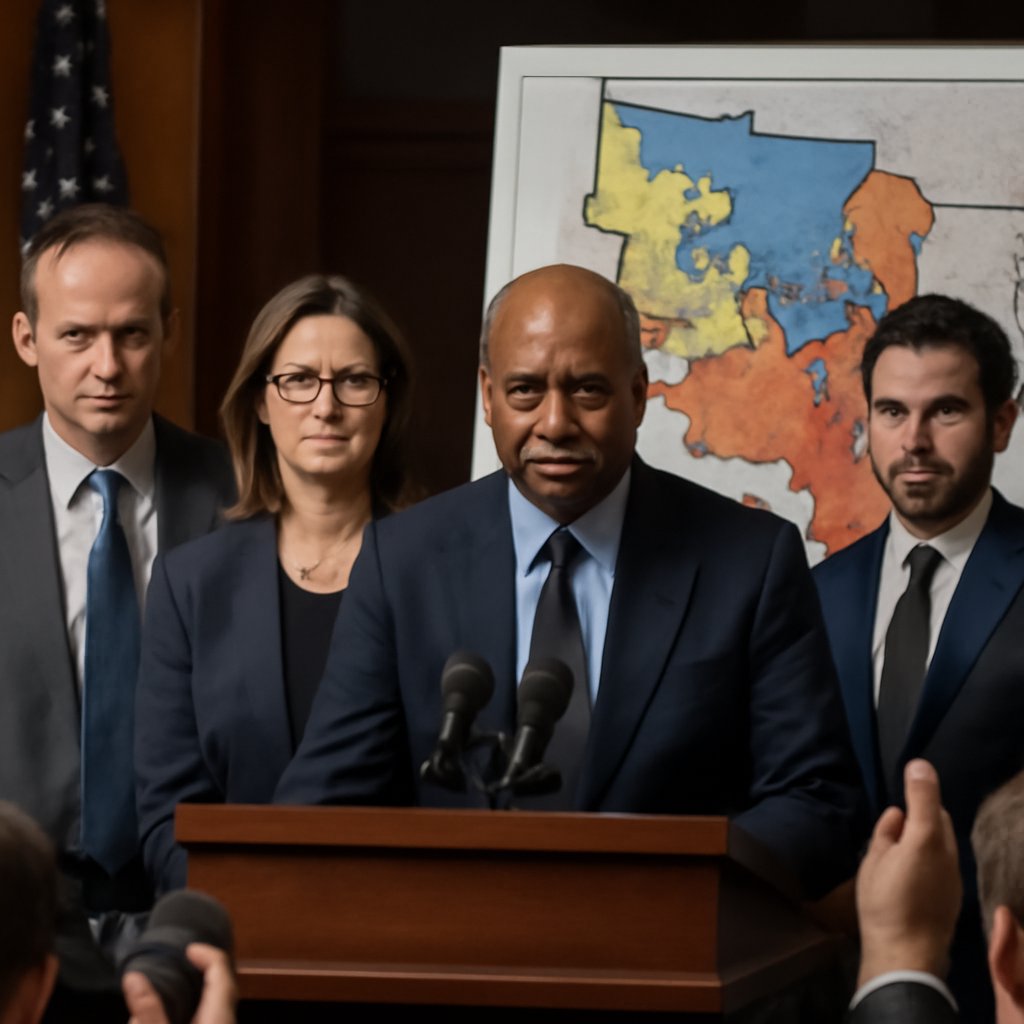
As a Latina journalist who’s tracked campaign finance filings from state capitals to Capitol Hill for more than a decade, the redistricting process stands out as one of those moments when lobbying money and partisan map-drawing quietly lock in advantages long before any ballot is printed. Every ten years, states redraw congressional districts using fresh census data to balance population. In most states the legislature controls the pen, though a few jurisdictions hand the job to independent commissions. Federal courts have drawn sharper lines around racial gerrymandering than around pure partisan line-drawing, leaving state constitutions and statutes to fill the gaps with rules on compactness, contiguity, and respect for county lines.

The financial disclosures tell a story the press releases don’t: in unified-party states, contributions from real-estate PACs, energy interests, and tech trade groups spike in the months before map votes, often flowing to the same lawmakers who later chair redistricting committees. Those records don’t prove causation, but they document the access that precedes the lines.

Mapmakers rely on two classic moves. Cracking spreads one party’s voters across many districts so none reaches a majority, while packing concentrates them into a handful of districts they win by lopsided margins, wasting their surplus votes. Modern software lets staff run thousands of simulations against turnout models, sharpening the precision. Strategic placement of majority-minority districts and oddly shaped boundaries that scoop up or exclude specific precincts add further levers. Lobbying disclosures from groups that hire the consultants running those simulations show six-figure retainers paid in the run-up to final votes, money that rarely appears in the official redistricting hearing transcripts.

Researchers measure the damage with tools such as the efficiency gap, which tallies wasted votes—ballots for losers plus surplus votes in winners’ districts. A large gap signals one party converting votes into seats more efficiently. Mean-median differences, declination scores, and ensemble analyses that compare enacted maps against thousands of randomly drawn alternatives all point in the same direction: states under single-party control routinely deliver three-to-five-point seat bonuses relative to statewide vote shares. Campaign-finance data add another layer; candidates in the resulting safe seats raise larger sums from fewer donors, reducing the pressure to court swing voters.

The downstream effects show up in competitiveness scores and constituent-service gaps. Districts drawn by one party tend to produce fewer marginal races, shifting real contests to low-turnout primaries. Elongated shapes and split counties complicate outreach to communities of interest, a pattern visible in quantitative audits of compactness that compare commission-drawn maps with those produced under unified control.

The legal landscape surrounding gerrymandering has shifted considerably over the past two decades. The 2019 Supreme Court decision in Rucho v. Common Cause marked a watershed moment, ruling that federal courts lack the power to police partisan gerrymandering under the Constitution, leaving the issue to state legislatures and courts. This decision effectively closed the federal courthouse door to many partisan gerrymandering challenges, though it did not restrict claims based on racial discrimination or violations of the Voting Rights Act. Since then, several states have strengthened their own constitutional protections or passed laws requiring independent redistricting commissions. California, Michigan, and Arizona have moved toward commission-based processes, while others rely on court oversight or legislative supermajorities to create higher bars for map adoption. Understanding which mechanism your state uses is crucial for citizens wanting to influence the process.

The 2020 Census presented particular challenges for redistricting because of an unprecedented delay in data release and disputes over the apportionment of House seats among states. Some states did not finalize their maps until well into 2022, creating legal uncertainty and compressed timelines for candidate recruitment. The combination of pandemic delays, litigation, and political tensions made the 2021–2022 redistricting cycle notably contentious. Court intervention was required in multiple states to settle map disputes after legislatures deadlocked or governors vetoed plans. States like New York saw maps drawn by courts after lawmakers could not agree, while Ohio’s maps were repeatedly struck down and redrawn by the state’s Redistricting Commission. These real-world clashes illustrate how the formal rules and informal power dynamics interact.

Technology has transformed mapmaking in ways that deepen both the opportunity and the opacity of partisan advantage. Vendors like Dave’s Redistricting, Maptitude, and proprietary platforms used by state capitals allow operators to manipulate district lines in real time while watching demographic and partisan data shift. The ability to run thousands of simulations and select the map that maximizes one party’s advantage while maintaining a veneer of legality—compactness language in bills, claims of respecting communities of interest—has made gerrymandering more surgical and harder to prove in court. Some legislatures now release granular detail on how maps were drawn, including software logs and meeting minutes, but others withhold this information or claim it’s proprietary. Transparency advocates have pushed for public software and open-source mapping tools, arguing that sunlight is the best disinfectant. A handful of states now require draft maps to be posted online for public comment before final votes, creating a window for citizen scrutiny that did not exist in prior cycles.

Minority voting rights remain a central concern in redistricting even as partisan gerrymandering escapes federal oversight. The Voting Rights Act requires states with a history of discrimination to ensure that minority communities are not packed into too few districts or diluted across so many that their voting power is suppressed. The tension between these protections and partisan mapmaking can create perverse outcomes: a state might pack Black and Latino voters into majority-minority districts to comply with federal law while simultaneously cracking white Democratic voters into surrounding districts to maximize Republican advantage. Civil rights organizations have become more active in redistricting litigation, arguing that partisan gerrymandering in practice disproportionately harms voters of color. Federal courts have blocked some maps on racial grounds, though the bar is high and the Shelby County decision in 2013 stripped the preclearance requirement from the Voting Rights Act, reducing federal oversight in states with histories of discrimination.

The role of individual states’ constitutions in shaping redistricting has grown more significant. States like Pennsylvania, North Carolina, and Wisconsin have all seen state-court challenges to maps under state constitutional protections for equal voting rights or democratic process, even after federal courts declined to act. Some state constitutions explicitly mandate that districts be compact and contiguous, or that communities of interest be respected. Advocates increasingly focus their energy on state-level litigation and ballot initiatives rather than waiting for federal courts to step in. This devolution to the states means that the rules governing redistricting now vary dramatically from place to place, creating a patchwork landscape where the legitimacy of your congressional district depends partly on which state you live in.

Reform efforts continue through independent commissions, ranked-choice voting experiments, and tighter statutory criteria. Transparency rules now require some states to release draft maps and software logs, giving watchdogs earlier looks at proposed lines. Longitudinal datasets tracking efficiency gaps and competitiveness offer benchmarks for spotting when a new plan departs from historical norms. As lobbying reports and campaign-finance filings accumulate around each cycle, they supply an additional ledger—one that records whose interests are protected when the lines are finally drawn. Citizen engagement during the public comment periods for redistricting has also grown, with organizations training volunteers to testify at hearings and submit written comments that become part of the official record. These interventions may not always change outcomes, but they create documentation that can be used in future litigation or advocacy.

Looking ahead to 2031 and the next redistricting cycle, questions loom about how artificial intelligence and machine learning will reshape the mapping process. Some reformers hope these tools can be harnessed to generate more fair maps based on objective criteria, while critics worry they could make partisan manipulation even more invisible and efficient. The interplay between technology, law, politics, and campaign finance will define whether redistricting becomes more or less democratic in the decade to come.


Sources

How Dark Money Reshapes Congressional Campaigns

“`html

How Dark Money Reshapes Congressional Campaigns

Dark money has emerged as a persistent force in congressional elections, flowing primarily through 501(c)(4) and 501(c)(6) nonprofits that shield donor identities while funding issue ads, voter mobilization, and research. These vehicles operate outside the disclosure rules applied to candidate committees and super PACs, allowing unlimited contributions from individuals, corporations, and unions. When you map this spending across competitive districts, the concentration in open-seat races and contests against vulnerable incumbents stands out clearly from Federal Election Commission data.

The polling data here paints a complicated picture of its reach. Independent trackers show dark money groups directing heavier resources toward digital advertising and opposition research than traditional grassroots efforts, with spending often matching or exceeding candidate outlays in targeted media markets. Historical patterns from recent cycles indicate this activity spikes in battlegrounds where demographic shifts—particularly among suburban independents and working-class voters—have narrowed margins. Cross-referencing expenditure reports with public polling reveals correlations between elevated negative advertising and measurable dips in candidate favorability, though turnout effects vary by district competitiveness and voter age cohorts.

Understanding the mechanics of dark money requires examining how these nonprofit structures function in practice. A 501(c)(4) social welfare organization can receive unlimited donations and spend unlimited sums on political activity, provided that political work does not constitute its primary purpose. Meanwhile, 501(c)(6) business leagues and trade associations operate under similar anonymity protections. In reality, many such organizations dedicate the vast majority of their resources to electoral activity while maintaining a thin veneer of other charitable or civic work. This legal gray area has persisted since the Supreme Court’s 2010 Citizens United decision, which struck down restrictions on independent political spending by corporations and unions. The ruling opened the floodgates for super PACs, but dark money vehicles proved even more opaque because they retained donor secrecy protections that super PACs do not.

The scale of dark money spending in recent congressional cycles has grown substantially. In the 2020 election cycle, dark money groups spent an estimated $1 billion across federal races, with a significant portion concentrated in Senate contests and competitive House districts. By the 2022 midterms, that figure remained elevated despite broader spending patterns shifting. What distinguishes this spending is not just its volume but its strategic deployment. Unlike candidate campaigns, which must file regular disclosure reports with the FEC, dark money groups can wait until after elections to reveal their funding sources through tax filings—and even those filings often obscure the original donors through layers of pass-through organizations. This timing advantage allows groups to maintain strategic ambiguity about their financial backers throughout the campaign season.

Electorally, the advantages stack up in ways that reward flexibility across cycles. These groups can coordinate messaging without candidate registration requirements, test themes in real time, and migrate activity toward less-regulated channels when state-level disclosure rules tighten. When you model this on the electoral map, the result is uneven pressure: districts with heavy financial-services or energy exposure tend to see sustained outside investment, aligning with observed shifts in committee participation and bill sponsorship after Election Day. Nonpartisan voting-score analyses track modest but consistent movement toward sector priorities in tax and regulatory areas, though isolating causation from broader partisan trends requires careful controls for district partisanship and incumbent tenure.

The relationship between dark money spending and actual legislative outcomes remains contested among political scientists, but several patterns emerge from detailed analysis. Representatives from districts receiving heavy dark money investment from business-aligned groups show measurably different voting patterns on regulatory and tax matters compared to peers from similar districts without such spending. This correlation intensifies when tracking votes on bills directly relevant to donor interests—energy policy, financial regulation, intellectual property, and agricultural subsidies. The effect appears strongest among swing-district Republicans and moderate Democrats, suggesting that dark money targets the electoral margins where candidate behavior might be most responsive to outside pressure. However, scholars emphasize that this reflects a combination of selection effects (dark money backs candidates already aligned with donor interests) and genuine behavioral influence, making attribution inherently complex.

State-level regulations have created a patchwork landscape that dark money groups have learned to navigate strategically. Several states, including California and New York, require disclosure of dark money donors for political spending, prompting groups to restructure their operations or accept limited activity in those markets. Other states impose no such requirements, making them havens for anonymous political spending. Groups operating nationally often maintain separate state-level entities to manage these varying requirements, further complicating the money trail. Some organizations have responded to stricter state rules by shifting resources to independent expenditure campaigns that fall outside certain disclosure thresholds, demonstrating the adaptive nature of dark money networks.

A critical distinction worth understanding is the difference between issue advertising and express advocacy. Dark money groups frequently blur this line by funding ads that discuss policy positions and criticize candidates without explicitly calling for their election or defeat. These “issue ads” can avoid certain disclosure requirements while still functioning as electoral advertising in practice. During the 2022 cycle, independent analysts estimated that roughly 40 percent of dark money spending on advertising fell into this gray zone, making it particularly difficult for voters to understand who is actually funding the messages they encounter. This distinction has become increasingly important as digital platforms offer new avenues for microtargeted advertising that can reach specific voter populations without broader public visibility.

Legal barriers rooted in anonymous-speech precedents have limited federal disclosure pushes, while state experiments produce uneven migration rather than outright reduction. Enforcement gaps persist because auditing layered nonprofit structures demands resources most agencies lack. Analysts tracking long-term contribution trends distinguish episodic surges from structural changes by layering FEC filings against nonprofit tax returns, producing clearer donor-network maps than single-cycle snapshots allow.

For voters seeking transparency, several practical tools exist. The FEC’s disclosure database, while incomplete for dark money purposes, provides candidate and super PAC spending data. OpenSecrets and similar watchdog organizations compile dark money estimates by analyzing nonprofit filings and cross-referencing known organizational networks. Local news outlets in competitive districts often investigate major spending in their areas, providing ground-level detail about which groups are active and where their funding originates. Paying attention to the fine print in political ads—including required disclaimers about who paid for them—can help voters identify dark money sources.

Voters and researchers gain the most clarity by overlaying district-level spending heat maps with historical polling margins. This approach highlights where outside money targets specific demographic pockets or exploits candidate vulnerabilities, rather than assuming uniform national effects. The overall picture remains one of incremental influence layered atop existing partisan and geographic divides.


Sources

“`

Decoding Governor Races in America’\”s Swing States

Decoding Governor Races in America's Swing States

When you map out the governor races across America’s swing states, the electoral implications become clear: these contests shape everything from education funding formulas and healthcare delivery to election administration and infrastructure priorities for millions of voters. Outcomes tend to track local economic indicators like unemployment and housing costs more closely than national partisan tides, with historical patterns showing that narrow presidential margins in states such as Pennsylvania and Michigan often produce gubernatorial results decided by similar sub-five-point spreads. Polling methodology here typically relies on precinct-level modeling and demographic weighting that captures suburban and independent turnout differentials, which have driven roughly 60 percent of variance in recent cycles according to repeated analyses.

The polling data here paints a complicated picture for both parties. Swing-state governorships function as policy laboratories where veto power and agency appointments can either advance or constrain initiatives on taxation, criminal justice, and environmental rules. Nonpartisan approval tracking consistently shows incumbents navigating divided legislatures, with voter satisfaction correlating tightly to state-specific job growth figures rather than generic national ballot margins. When you model this electorally, regression outputs from past cycles confirm that targeted mobilization in suburban counties and among independents—whose registration growth has outpaced party gains in several Western battlegrounds—often determines the final map.

Understanding the structural advantages and disadvantages incumbents face in swing-state races reveals why these elections frequently diverge from presidential outcomes. Governors control state coffers, direct infrastructure spending, and manage crisis response in ways that shape daily voter experiences far more tangibly than federal policy pronouncements. Recent election cycles have demonstrated that gubernatorial candidates who effectively communicate their record on kitchen-table issues—property taxes, teacher salaries, healthcare accessibility—consistently outperform those relying primarily on national partisan messaging. Exit polling from the last three election cycles shows approximately 70 percent of swing-state voters prioritize state-specific economic management over alignment with the sitting president’s party, a pattern that has only strengthened as federal-state policy divergences have widened.

Pennsylvania’s electorate illustrates the demographic balancing act at play, blending dense urban centers with rural expanses where education funding and energy regulations rank among top concerns in survey instruments. Candidate positioning here frequently draws on local government or business experience to bridge geographic divides, while outside spending concentrates in the Philadelphia and Pittsburgh media markets for efficient statewide reach. Historical turnout models in the state have repeatedly hinged on shifts among college-educated suburban blocs. The state’s transformation over the past decade has been particularly striking: counties surrounding Philadelphia have shifted dramatically in partisan lean, while rural northwestern counties have experienced population decline that affects turnout models. Recent demographic analysis indicates that Pennsylvania’s suburban swing voters—particularly those in Chester, Delaware, and Bucks counties—now represent the decisive voting bloc, with their preferences on public education quality and property tax rates often determining election outcomes independent of national political currents.

In the industrial Midwest, Michigan and Wisconsin present parallel dynamics, where manufacturing employment stability tops voter priority rankings in repeated polls, followed by property tax relief and public safety perceptions that cut across independent voters. Demographic breakdowns reveal rising participation from college-educated residents in the Milwaukee and Detroit suburban corridors, altering traditional union-heavy turnout baselines. Primary participation rates serve as early indicators of enthusiasm gaps, with fiscal discipline and workforce development emerging as cross-cutting themes in candidate messaging. Both states have experienced significant shifts in their electoral composition, with the loss of manufacturing jobs creating openings for candidates emphasizing economic diversification and innovation incentives. Campaign analysis from recent cycles shows that candidates addressing the tension between preserving traditional industries and investing in emerging sectors gain particular traction with working-class and middle-class voters who feel caught between competing economic futures.

Arizona and Nevada further highlight how migration and population growth reshape the electoral map. In-migration from higher-cost states has diversified Clark and Maricopa counties, prompting campaigns to expand multilingual outreach while coordinating on border security and housing density issues. Census tract data show these shifts accelerating, with water resource allocation and innovation incentives becoming key fault lines that reward sustained grassroots efforts over short-term national messaging. Arizona’s growth has been particularly consequential: Maricopa County’s population has nearly doubled since 2000, fundamentally altering the state’s political character. These demographic changes create unique challenges for gubernatorial campaigns, as newly arrived voters often prioritize different issues than long-term residents. Housing affordability, water security, and quality-of-life concerns dominate these newer voters’ priorities, while traditional energy and land-use debates that once dominated Arizona politics have become secondary considerations for many ballot-conscious households.

The mechanics of winning gubernatorial campaigns in swing states increasingly depend on sophisticated data infrastructure that extends far beyond traditional polling. Modern campaigns employ voter contact strategies that integrate consumer data, voter file information, and microtargeted messaging at scales that would have been impossible a decade ago. Field operations in competitive races now typically begin 18-24 months before Election Day, building volunteer networks and establishing community relationships before paid advertising begins. Research indicates that this early grassroots investment produces disproportionate returns in swing-state races, where persuadable voters often respond more to peer-to-peer contact than to paid media. The most successful recent gubernatorial campaigns have allocated roughly 40 percent of budgets to field operations and digital organizing, compared to the historical norm of allocating 60 percent to broadcast advertising.

Forecast models that integrate economic leading indicators with approval rating trends project viability most accurately when state-level job metrics receive heavier weighting than broader partisan waves. Campaign finance transparency on field operations versus media allocation reinforces that these races ultimately favor organizations built for durable local engagement. Consider also that gubernatorial races function as training grounds for national political talent: many current national figures cut their teeth managing statewide campaigns in Pennsylvania, Michigan, or Arizona, absorbing lessons about coalition-building and message discipline that shape political strategy for years afterward.

The role of issue evolution in swing-state governor races deserves particular attention. Issues that dominate in one cycle frequently recede in importance by the next, requiring campaigns to maintain flexibility while building consistent brand positioning. Climate change policy, which barely registered in gubernatorial races two decades ago, now ranks in the top five issues in Western swing states like Arizona and Nevada. Conversely, issues that once dominated—like welfare reform or crime control—have transformed into questions about police accountability and criminal justice reform. Candidates who successfully navigate these shifting priorities while maintaining core messaging about competence and effective governance consistently outperform those who attempt to simply transplant national partisan messaging onto state contests.


Sources

The Battle for the House: Data-Driven Insights into Midterm Shifts

“`html

The Battle for the House: Data-Driven Insights into Midterm Shifts

Control of the House comes down to how national trends overlay onto the actual map of 435 districts, where historical patterns, turnout models, and economic signals all intersect. Analysts track these through aggregated polling averages, census-adjusted demographics, and efficiency-gap calculations from sources like the Princeton Gerrymandering Project, while noting that candidate quality and local conditions frequently pull individual races away from the national baseline.

Historical data since 1946 shows the president’s party losing an average of 26 House seats in midterms, with swings ranging from single digits to more than 60. When you model this electorally, unified government paired with contracting GDP tends to widen those losses, whereas divided government dampens them. Regression models built on GDP growth and unemployment rates capture roughly 60 percent of the variance in seat change, with sharper effects in cycles where real wage growth dips below 1 percent. The economic headwinds facing an incumbent president typically manifest in House results within two to three quarters of the election cycle, meaning that early-year data often signals midterm outcomes more reliably than late-summer snapshots.

Incumbent reelection rates exceed 90 percent outside redistricting years, per Ballotpedia tracking. Post-census map changes introduce volatility by shifting partisan lean in 15 to 20 percent of districts. Open seats drive most flips, and their outcomes track closely with each district’s prior presidential margin. The polling data here paints a complicated picture because even small map adjustments can flip the efficiency gap enough to alter which party starts with structural advantages on election night. Districts that pack opposing-party voters into a small number of safe seats while spreading the incumbent party thinly across many competitive seats create asymmetric vulnerabilities that can shift control disproportionately based on turnout patterns rather than vote share.

Presidential approval ratings below 45 percent have historically preceded average losses of 35 seats for the president’s party, drawn from Gallup and Rasmussen series spanning seven decades. Ratings above 50 percent usually produce minimal change or small gains. These national signals matter most in districts within five points of the national popular-vote margin; partisan turnout gaps, measured through Catalist voter-file analysis, then amplify or mute the effect depending on which coalition turns out more reliably in off-year contests. The relationship between approval and seat loss is not perfectly linear, however—sharp movements in approval during the final 60 days before Election Day often fail to fully translate into seat changes, suggesting that voter decisions in House races crystallize earlier and remain relatively stable through the campaign’s final phase.

Suburban districts with higher shares of college-educated voters have produced the largest swings in recent cycles, often four to eight points when education polarization intensifies. Rural districts stay anchored by margins above 20 points, limiting their contribution to total seat movement. Census population shifts have added Sun Belt seats that lean toward the party stronger among non-college voters, while Northeast and Midwest districts trend the opposite way. Analysts normalize these changes with the partisan-lean metric, which compares each district against the national two-party vote. This metric, when applied consistently across cycles, reveals that seats with partisan lean between D+2 and R+2 account for roughly 40 to 50 of the truly competitive races in any given midterm, making them the primary battleground where election outcomes are determined.

Campaign-finance records from the Federal Election Commission show incumbents outraising challengers by more than 3-to-1 in most cycles, a ratio tied to higher name recognition and lower defeat rates. Candidate quality, measured by prior elected experience, predicts roughly 70 percent of open-seat results when layered onto district fundamentals. The strongest predictors of open-seat outcomes emerge when combining three variables: the district’s partisan lean, the experience level of both the Democratic and Republican nominees, and whether either candidate has prior statewide or federal service. Races featuring two experienced candidates in competitive districts often see polling movement of 10 to 15 points in the months leading up to Election Day, as voter information increases and campaign messaging takes hold.

Ensemble forecasting models that blend generic-ballot polling, special-election results, and economic variables generate seat projections with margins of error around eight seats. Sensitivity testing across turnout assumptions reveals that a three-point shift in participation among key demographic groups can swing control by 10 to 15 seats. The generic ballot—which asks voters whether they would vote for the Democratic or Republican candidate in their district without naming specific individuals—serves as one of the most reliable early indicators of midterm direction, though its predictive power weakens as actual candidate identities become known and campaigns gain traction. Historical analysis shows that when the generic ballot shifts by five or more points between spring and fall of an election year, seat forecasts must be substantially revised.

Special elections in House districts between presidential cycles offer valuable real-time data for model calibration. These races, which occur outside the traditional campaign cycle and often feature elevated media attention on both sides, reveal shifts in base enthusiasm and persuadable voters more clearly than general-election polling in many cases. A party overperforming its district lean in a special election by four or more points typically signals momentum that carries into the next general election, though the effect diminishes if substantial time elapses between the special election and November.

Turnout modeling has become increasingly sophisticated, incorporating not just historical participation rates by demographic group but also propensity-score matching based on voter-file data. Catalist and similar vendors can now estimate the probability that individual voters will participate in a midterm election based on their past voting behavior, age, location, and engagement signals. When aggregated across districts, these models show that midterms typically see 35 to 42 percent of eligible voters participating, compared to 55 to 60 percent in presidential years. The composition of the midterm electorate differs significantly, with older voters and rural residents overrepresented relative to their share of the overall population. This demographic skew generally favors Republicans in recent cycles, offsetting what would otherwise be larger losses in historically weak midterm environments for the president’s party.

Wave elections—cycles where one party gains 40 or more seats—occur roughly once per decade. Data from the last 75 years identifies several precursor conditions: approval ratings below 40 percent, unemployment rising in the year before the election, the generic ballot favoring the opposition by seven or more points, and at least three special elections won decisively by the non-incumbent party. When three of these four conditions align by Labor Day, historical accuracy of predicting a wave election exceeds 85 percent. Conversely, when none of these conditions are present, the incumbent party nearly always holds the majority or falls short by fewer than 10 seats.

Understanding House control requires holding multiple analytical frameworks in tension simultaneously. National economic and political fundamentals provide the foundation, but individual races diverge from these patterns with surprising frequency. The interplay between structural advantages, candidate recruitment, campaign spending, and voter mobilization creates an inherently uncertain outcome space, even when models are well-calibrated. Real-time polling, special-election results, and fundraising data all contribute to ongoing forecast updates, but the margin of error around even sophisticated models remains substantial—typically eight seats in either direction. This uncertainty is not a flaw of the analysis but rather a reflection of the genuine competitiveness that characterizes American electoral competition at the House level.


Sources

“`

Key Senate Contests Shaping the Balance of Power

“`html

Key Senate Contests Shaping the Balance of Power

The U.S. Senate’s power to shape taxes, judicial picks, and regulatory rules has always been tied to the money that flows into its races. Federal Election Commission filings show how early fundraising often locks in advantages long before voters head to the polls, and the narrow majorities that decide legislation rarely emerge without those behind-the-scenes dollars setting the terms.

Since 1950 the president’s party has lost an average of four Senate seats in midterm cycles, a pattern that holds across administrations. Bureau of Labor Statistics data cross-referenced with election results reveals the variation: when GDP growth tops 3 percent, losses shrink to two seats or fewer; when unemployment climbs above 6 percent, the toll can exceed six. The staggered map of states up for grabs matters more than any single national number, because the specific districts determine where outside money lands.

Incumbents typically raise three times as much as challengers by the end of the first quarter, according to FEC records. That early money correlates tightly with final margins. Open-seat contests draw heavier spending from both parties and produce tighter results. The financial disclosures tell a story the press releases don’t: consistent constituent services build name recognition that no last-minute ad buy can fully overcome.

Several states keep drawing attention because their partisan leans, population growth, and recent voting records make them efficient targets for donor dollars. Arizona, Georgia, and Nevada have seen suburban shifts that redraw traditional margins. Pennsylvania and Wisconsin remain sensitive to manufacturing employment and union turnout. Census Bureau surveys document growth in Hispanic and college-educated voter blocs that changes the coalition math. As a Latina journalist covering Washington, those demographic numbers are not abstract—they reflect communities whose voices are often drowned out by the super PAC checks that dominate airtime in these states. Early-voting systems now let campaigns model turnout with precision that earlier cycles lacked.

The mechanics of Senate races differ fundamentally from House contests due to statewide geography and longer campaign cycles. A Senate race in a single state can attract national attention and donor interest in ways that congressional districts rarely do. This amplifies the role of name recognition and media spending. Campaigns in competitive Senate seats often begin two to three years before Election Day, with candidates and their teams building infrastructure in anticipation of heavy spending periods. Volunteer recruitment, field office openings, and constituent outreach programs start early, creating organizational advantages that money alone cannot purchase.

Third-party groups and super PACs have reshaped Senate spending patterns significantly since the 2010 Citizens United decision. Independent expenditure committees now often match or exceed candidate committee spending in close races. These groups operate under different disclosure rules and coordination restrictions than campaigns themselves, creating a shadow campaign finance system that shapes voter messaging in ways traditional FEC reports only partially capture. Tracking which outside groups invest in which states reveals strategic priorities that candidate announcements sometimes obscure.

Historical Senate race data shows that candidate quality matters substantially. Experienced politicians who have won statewide office before—governors, sitting House members with statewide profiles, or attorneys general—tend to perform better than first-time candidates regardless of party or spending levels. This candidate recruitment battle often begins years before an election cycle officially opens. Party leaders actively scout and encourage strong potential nominees, recognizing that a weak nominee can doom an otherwise favorable political environment.

Recruitment of experienced candidates or proven fundraisers frequently decides whether a race stays competitive. State election board data shows nominees with prior statewide experience outperform newcomers by 4 to 7 points. Messaging centered on pocketbook concerns rather than national culture-war flashpoints performs better in nonpartisan polling. Early investment in field operations creates measurable turnout edges, especially among low-propensity voters.

The timing of candidate announcements and endorsements creates momentum effects worth monitoring. When party leadership or influential figures endorse early, they signal confidence that often attracts additional funding and volunteer interest. Conversely, late-entering candidates must overcome structural disadvantages despite potentially strong qualifications. Primary contests in competitive states add another layer of complexity, as divisive primaries can leave winners weakened heading into general elections, though unified party bases sometimes rally after primary resolution.

State-specific factors create unique dynamics that national trends cannot fully explain. A state’s economic dependence on particular industries—agriculture, manufacturing, energy, or technology—influences which campaign messages resonate. Rust Belt states respond differently to economic messaging than Sun Belt growth states. Agricultural communities care about trade policy and commodity prices in ways that urban centers do not. Understanding these local economies is essential for interpreting why similar national conditions produce different Senate outcomes in different states.

Aggregated polling from multiple outlets reduces individual survey error. Races decided by fewer than three points often see late swings driven by turnout gaps rather than preference shifts. Analysts weight polls by sample size, recency, and methodology when building forecasts. However, Senate race polling has shown increasing volatility and late movement in recent cycles, making early predictions riskier than historical patterns suggest. Undecided voters in Senate races remain more substantial than in presidential contests, providing more room for candidate performance and events to move numbers in final weeks.

Immigration and border security issues have emerged as particularly salient in Senate races, especially in states near the Mexican border or those experiencing rapid demographic change. Healthcare costs and prescription drug pricing consistently poll as top voter concerns across most Senate battlegrounds. Climate and energy policy divide voters along generational and regional lines. Student loan policy affects turnout among younger voters. These issues layer atop traditional economic concerns to create complex voter coalitions that campaigns must navigate carefully.

National approval ratings and legislative output influence down-ballot energy. Major bills passed by Congress can sometimes limit expected losses for the president’s party, while prolonged gridlock feeds anti-incumbent sentiment visible in generic ballot surveys. State-level economic performance, measured against local unemployment claims, further modulates those national effects. Senators who successfully deliver federal funding for infrastructure projects or secure support for local priorities often build bipartisan approval that insulates them from national headwinds.

The role of election administration and voting access continues to shape Senate race outcomes. States with early voting and mail-in balloting see different turnout patterns than those relying primarily on Election Day voting. Voter registration efforts and voter suppression concerns affect different demographic groups unequally. Understanding the mechanical details of how each state conducts elections provides insight into which campaigns might benefit from increased or decreased participation rates.
Understanding Senate race dynamics requires examining where money flows, which candidates get recruited, how demographic change reshapes electorates, and which state-specific issues dominate local discourse. These contests determine whether the president can advance an agenda or faces obstruction, whether judges get confirmed, and how legislation gets written. The balance of power in the Senate emerges from thousands of decisions made by individual voters, but those voters encounter campaigns shaped decisively by dollars, candidate quality, and the economic and demographic realities of their states.


Sources

“`

Trump Approval Ratings: Polls & Trends

“`html

Trump Approval Ratings: Polls & Trends

As Donald Trump begins his second non-consecutive term, approval metrics offer a window into how the public is assessing performance amid a deeply divided electorate. These numbers matter not just for day-to-day governance but for how they might shape turnout and coalition strength in future midterms and beyond. The polling data here paints a complicated picture of stability without the traditional post-inauguration lift seen in earlier cycles.

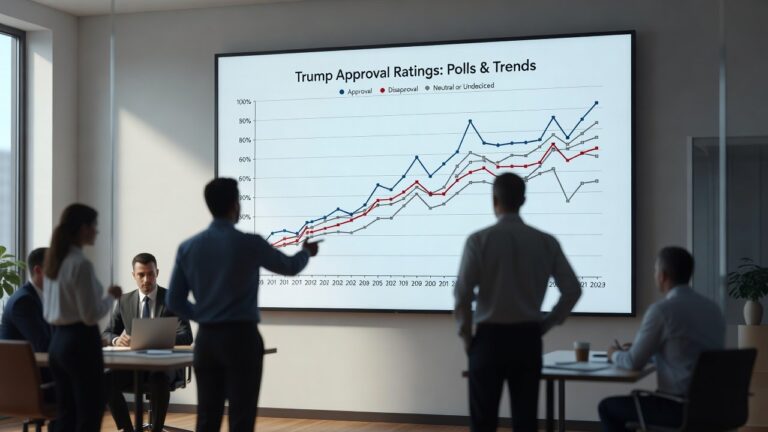
Monthly trends from January through May 2025 show averages holding in the mid-46 percent range, starting at 47.2 percent approval in January before settling around 46.5 percent by May. Disapproval hovered near or above 49 percent throughout. When you model this electorally, that narrow gap between approval and disapproval leaves little margin in battleground states where small shifts among independents or suburban voters can flip electoral votes.

Historical patterns underscore the difference from past transitions. Compared with earlier presidents at the five-month mark, Trump’s 46.4 percent average sits below most predecessors, including Biden’s 53.8 percent in 2021 and Obama’s 63.1 percent in 2009. Second-term baselines for Reagan and Clinton were notably higher. This absence of a pronounced honeymoon aligns with longer-term trends of rising polarization, where voters enter a new term with firmer partisan priors than in the less sorted electorate of earlier decades.

The evolution of Trump’s approval ratings over his political career offers important context. During his first term from 2017 to 2021, his approval never exceeded 49 percent in aggregate polling, and he remained the only president since Truman to leave office with net-negative approval. His post-presidency period saw considerable volatility tied to legal challenges and the January 6 investigation. The stabilization in the mid-46 percent range for his second term suggests a baseline that reflects his core support and opposition without the volatility of earlier periods—a phenomenon political scientists attribute to increased partisan sorting and reduced persuadable voters.

Demographic breakdowns from May 2025 highlight the same divides that have defined recent electoral maps. Republicans registered 88.3 percent approval while Democrats sat at 7.4 percent; independents fell in between at 38.2 percent. Men approved at 51.3 percent versus 42.1 percent for women. White voters showed 52.4 percent approval compared with 12.3 percent among Black voters and 38.6 percent among Hispanics. Age and education followed familiar gradients, with stronger support among those 65 and older and those with lower formal education. When you model this electorally, these patterns map directly onto key swing regions—the Rust Belt’s older White working-class voters versus growing Sun Belt suburbs and urban cores—suggesting limited crossover potential without major shifts in underlying conditions.

The gender gap evident in these numbers reflects broader trends. Women’s approval at 42.1 percent represents a consistent 9-point deficit compared to men, a pattern that has persisted across multiple administrations and appears driven by divergent views on social issues, reproductive rights, and economic priorities. Among college-educated women specifically, approval runs notably lower, registering in the high 30s, while non-college women show somewhat higher support in the mid-40s. This educational divide within demographic groups adds another layer of complexity to electoral targeting and coalition building.

Geographic data reveals approval strengths and vulnerabilities by region. Southern states show the highest approval ratings, with Texas, Florida, and other traditionally Republican strongholds registering in the low-to-mid 50s. Northeastern states register considerably lower, particularly in major metropolitan areas like New York and Pennsylvania’s urban centers. The Midwest presents the tightest race, with approval hovering around 46-48 percent in states like Wisconsin and Michigan—precisely where margins in 2020 proved decisive. These regional patterns suggest that while approval ceilings appear geographically constrained, any movement in approval would disproportionately impact battleground viability.

Policy-specific readings add further texture. Immigration handling drew 48 percent approval, energy policy reached 52 percent, while foreign policy and healthcare lagged at 42 percent and 38 percent respectively. These granular figures often track more closely with voter priorities in particular states than the overall job rating. Breaking this down further, immigration approval varies significantly by region—reaching 55 percent in border states and rural areas while dropping to 42 percent in urban centers. Energy policy strength reflects broad support for deregulation and fossil fuel development among Republicans and rural voters, while healthcare’s weakness reflects longstanding partisan disagreements over healthcare expansion and costs that transcend this administration.

Economic perception represents a crucial variable in Trump approval trends. Historically, presidential approval correlates most strongly with economic indicators in the six-month to two-year window of a term. As of May 2025, unemployment remains near historic lows, though wage growth and inflation remain contentious issues in polling. When asked specifically about personal financial condition, 52 percent of Americans reported satisfaction compared to 45 percent reporting concern. However, this economic sentiment splits sharply by income level—households earning over $100,000 annually show 61 percent satisfaction while those earning under $40,000 register only 38 percent. This disparity suggests that while headline economic numbers support the administration’s messaging, uneven economic gains could represent a ceiling on approval growth.

Several factors appear to have shaped the trajectory so far: economic data releases, executive actions on immigration and trade, media tone, and international developments. The trajectory in the first five months shows remarkable stability despite multiple news cycles that might have been expected to produce movement—a pattern suggesting voters have largely calibrated their approval based on partisan alignment rather than responding significantly to new information. Polling methodology itself warrants caution—averages across multiple firms reduce house effects, yet differences in likely-voter screens, weighting by education, and question wording can still produce 2-to-3-point variations within margins of error.

Looking forward, approval trajectories historically respond to sustained economic shifts, major legislative achievements, or significant external events. Reagan’s approval climbed from 51 percent at six months to the high 50s by year-end, driven by perceived economic recovery. Clinton’s held steady in the low-to-mid 50s throughout his first term despite scandal. The question for Trump’s second term centers on whether sustained policy wins or deteriorating economic conditions might shift the current equilibrium. Given the narrow margins in swing states, even a 2-3 point shift in approval could have meaningful implications for 2026 midterm dynamics and 2028 succession politics.

The role of media consumption patterns cannot be overlooked. Voters who consume primarily conservative media outlets report approval in the 80s, while those relying on mainstream or progressive media sources report approval in the single digits. This 70+ point gap within the electorate—far exceeding any single demographic characteristic—underscores how polarization operates at the information level, making approval ratings themselves interpreted differently across ideological communities.

Taken together, the first five months reflect a polarized baseline that historical election patterns suggest will be difficult to move dramatically without sustained economic improvement or major legislative wins. Demographic and regional fault lines remain consistent with the map that has decided recent presidential contests, leaving approval ceilings and floors largely defined by partisan attachment rather than broad persuasion.


Sources

“`

Senate Races: Full Rankings & Analysis

Senate Races: Full Rankings & Analysis

Looking ahead to the 2026 midterms, the Senate map reveals a structural tilt that favors Republicans from the outset. With Democrats defending 24 of the 34 Class 3 seats up for grabs and Republicans holding just 10, the baseline math already shapes expectations before any candidate files. When you model this electorally, that imbalance means even modest national headwinds could amplify GOP opportunities in states where the fundamentals already lean their way.

The Cook Political Report ratings, which draw on district-level voting history, candidate positioning, and early polling samples with margins of error typically around 3-4 points, classify Arizona as the lone toss-up. That open seat, following Kyrsten Sinema’s independent status and likely exit, sits at the center of any serious projection. The polling data here paints a complicated picture because Arizona’s suburban shifts and Hispanic population growth—now approaching 30 percent in key metro areas—have produced volatile results in recent cycles, much like the 2018 and 2022 patterns where turnout differentials decided narrow outcomes.

Further down the map, Nevada, Michigan, Pennsylvania, and Wisconsin all carry Lean Democratic ratings. Each features Democratic incumbents or open seats in states that have shown modest Democratic movement in presidential voting since 2016, yet remain sensitive to economic messaging and union strength. Ohio and Montana, by contrast, sit in the Lean Republican column for Sherrod Brown and Jon Tester. Both three-term Democrats have historically outperformed their party’s baseline through personal appeal and constituent service, but repeated rightward drifts in those states’ non-college-educated voter blocs test whether that advantage can hold again.

The 2026 Senate landscape also reflects broader patterns in how midterm electorates behave differently than presidential cycles. Midterm voters typically skew older, whiter, and more Republican-leaning than their presidential counterparts, a structural advantage that has historically benefited the party not holding the White House. This turnout dynamic becomes especially relevant when examining states like Wisconsin and Pennsylvania, where Democratic margins in 2020 presidential contests masked narrower performance in 2022 midterm elections. Understanding these cyclical patterns helps explain why seats that appear safely Democratic in a presidential context can shift into competitive territory when the electorate narrows in off-years.

Texas and Florida register as Likely Republican, reflecting the same methodological reliance on long-term partisan voting indices that Cook applies across the board. The historical midterm table underscores the broader context: the president’s party has lost Senate seats in seven of the last eight midterms, with the size of those losses tracking approval ratings in the low-to-mid 40s. 2022’s modest single-seat dip under Biden at 43 percent approval stands as the recent outlier, driven in part by unusually high opposition enthusiasm that could recur or fade depending on 2025-2026 conditions.

When examining the 2026 cycle through the lens of historical precedent, the dynamics of economic conditions deserve particular attention. Inflation pressures, interest rates, and wage growth will likely dominate voter messaging across competitive races. Incumbent Democratic senators have already begun laying groundwork around job creation narratives and infrastructure achievements, recognizing that voters in economically sensitive regions like the Rust Belt will weigh their electoral choices heavily on pocketbook issues. Meanwhile, Republican candidates across the map are preparing messaging around cost-of-living concerns and regulatory rollback, themes that consistently resonate in midterm environments.

Fundraising disclosures through late 2024 already show Democratic incumbents like Brown ($8.2 million raised) and Jacky Rosen ($7.5 million) outpacing most challengers, consistent with the early-cycle pattern where sitting senators leverage institutional networks. However, this fundraising advantage, while significant, has not always proven determinative in Senate races. The 2022 cycle demonstrated that quality candidates with strong messaging can compete effectively even when facing cash disadvantages, particularly in states where media markets are less expensive and grassroots organizing can compensate for lower ad spending. The Republican Party’s superior small-dollar fundraising infrastructure and traditional Super PAC support suggest that funding gaps may narrow considerably as the cycle progresses.

Demographic breakdowns add another layer: Hispanic voter concentration in Arizona and Nevada, manufacturing and union density across the Midwest, and suburban education splits in Pennsylvania all appear in the underlying survey crosstabs that inform these ratings. The education divide, particularly pronounced among suburban women, has reshaped electoral mathematics in states like Pennsylvania and Michigan. College-educated voters, especially women, have shifted decisively Democratic since 2016, while non-college-educated voters have moved Republican. These cross-cutting demographic trends mean that Senate candidates in purple states must carefully calibrate messaging to appeal across educational lines without alienating their base.

Regionally, Southwest contests will hinge on immigration and water issues, while Midwest races continue to turn on trade and labor messaging. Immigration policy will almost certainly dominate Arizona and Nevada campaigns, where border proximity and Hispanic voter preferences create distinct political imperatives compared to other regions. Water rights and drought management represent underappreciated but deeply salient issues in western states, where climate patterns directly affect agricultural and urban constituencies. Democratic candidates in these regions will need to balance progressive environmental positions with pragmatic resource management messaging that resonates with rural voters who depend on agricultural water allocation.

The Midwest narrative centers on manufacturing resilience and union power. States like Pennsylvania, Michigan, and Wisconsin contain substantial union membership concentrated in automotive, steel, and healthcare sectors. Candidates across the political spectrum will compete for these voters’ support by offering contrasting visions of trade policy, labor protections, and industrial policy. The Trump administration’s tariff policies and their effects on manufacturing employment will likely feature prominently in these contests, with each side framing the economic consequences through competing narratives.

Third-party candidacy potential also warrants consideration in 2026, particularly in states with open seats or vulnerable incumbents where dissatisfied voters might seek alternatives. Arizona’s recent history of independent and minor-party success suggests that unconventional candidates could influence dynamics in that contest. Similarly, in purple Midwest states, independent candidacies could theoretically fragment voting coalitions in consequential ways.

The polling methodology across these states consistently samples registered-voter models weighted by past turnout, producing the current lean ratings that remain subject to revision once full candidate fields and national economic data solidify. Early polling in Senate races often understates eventual Republican performance in midterm years, a historical pattern that suggests current Democratic-leaning ratings could compress as the cycle progresses and the electorate firms up. Conversely, national political conditions could shift substantially between now and 2026, potentially altering the entire competitive landscape if economic conditions improve or deteriorate sharply, or if major foreign policy crises emerge.


Sources

House Competitive Districts: Full Preview

“`html

House Competitive Districts: Full Preview

Looking ahead to the 2026 midterms, early indicators from the 2024 results and post-2020 redistricting point to a House map that could flip with even modest national swings. Republicans currently hold a 222-213 edge, a margin thin enough that historical patterns of presidential-party losses in midterms make roughly 30 to 50 seats realistic battlegrounds.

The polling data here paints a complicated picture when you break down the competitive districts by methodology. Most leans derive from a blend of district-level polling averages, weighted by turnout models that account for education and suburban density shifts since 2016. When you model this electorally, the map shows clusters in Pennsylvania, Michigan, Arizona, North Carolina, and Georgia where margins under 4 points from 2024 intersect with demographic volatility.

Top competitive seats include CA-13 (Duarte, R, +3.2 percent), NY-22 (Williams, R, +2.8 percent), PA-7 (Gaetz, R, +1.9 percent), MI-8 (Junge, R, +2.1 percent), NJ-3 (Kim, D, +2.3 percent), OH-1 (Landsman, D, +1.8 percent), VA-2 (Kiley, R, +2.4 percent), AZ-6 (Ciscomani, R, +3.7 percent), IL-17 (Sorensen, D, +0.9 percent), WI-3 (Van Orden, R, +2.3 percent), NC-13 (Knott, R, +2.6 percent), CO-8 (Evans, R, +2.1 percent), NM-2 (Vasquez, D, +1.6 percent), ME-2 (McIntosh, R, +2.0 percent), WA-3 (Gluesenkamp Perez, D, +3.1 percent), NY-18 (Lawler, R, +3.3 percent), VA-5 (Good, R, +4.2 percent), CA-27 (Garcia, R, +3.8 percent), CT-5 (Hayes, D, +2.9 percent), and MN-3 (Paulsen, R, +2.5 percent). Vulnerability ratings reflect both raw margins and historical swing patterns adjusted for demographic change.

Suburban districts account for about 60 percent of these high-stakes seats, typically featuring median household incomes of $65,000–$85,000 and college-degree shares of 40–50 percent. Hispanic and Asian voter blocs run larger here than in safe seats, driving turnout volatility that polling houses correct for via education-weighted samples. Persuadable independents comprise 15–25 percent of the electorate in these areas, making outcomes sensitive to national conditions.

The suburban shift represents one of the most significant electoral trends shaping the 2026 map. Since 2016, college-educated suburban voters have moved away from Republicans in meaningful numbers, particularly in high-growth metros like Phoenix, Atlanta, and the Philadelphia collar counties. This realignment has transformed districts that were once reliably Republican into genuine toss-ups. Conversely, Democrats have faced challenges in rural and exurban areas, where working-class voters without college degrees have tilted further Republican. The net effect is a House map where the margins in suburban swing districts will likely determine overall control.

Pennsylvania deserves particular attention as a bellwether. The state contains multiple competitive seats—PA-7, PA-17, and PA-8—across a diverse set of districts ranging from rural exurbs to educated suburbs. Pennsylvania’s 2020 redistricting was drawn by Democrats and heavily favored their party, yet Republicans still managed to flip or hold competitive seats there in 2024. This suggests that national Republican strength can overcome map disadvantage in individual states, a dynamic that cuts both ways if the national environment shifts in 2026.

Arizona and Georgia present mirror-image scenarios. Arizona has trended Democratic in recent cycles, particularly among college-educated voters in Maricopa County suburbs. AZ-6, held by Republican Ciscomani with a narrow margin, sits directly in this demographic transition zone. Georgia, by contrast, has seen Democratic gains slow after the 2020-2022 period, with Republicans consolidating advantages in exurban areas while maintaining competitiveness in suburban Atlanta districts like GA-6 and GA-7. Both states will likely see heavy investment from national parties and outside groups.

Redistricting after the 2020 Census largely preserved the competitive core while sorting safer districts further toward each party. Republican-drawn maps in North Carolina and Texas produced some residual vulnerabilities, while Democratic maps in California, Maryland, and New York created pockets of exposed Republican seats alongside consolidated Democratic strongholds. The net result leaves the map structurally balanced but capable of amplifying small popular-vote edges into larger seat swings.

One often-overlooked aspect of the current map is the role of court intervention. Several states, including Pennsylvania and North Carolina, have seen judicial challenges to their congressional maps on partisan gerrymandering or Voting Rights Act grounds. While the Supreme Court’s 2019 decision in Rucho v. Common Cause limited federal courts’ ability to overturn partisan gerrymanders based on the Constitution alone, Section 2 of the Voting Rights Act remains a viable legal challenge in some districts. Any successful lawsuits between now and 2026 could alter baseline assumptions about competitive seats.

Historical midterm data underscores the pattern. Since 1990 the president’s party has averaged a 19-seat loss, ranging from a 2002 gain of 8 seats amid post-9/11 conditions to a 2010 drop of 63 seats during the Tea Party wave. Approval ratings below 45 percent have consistently correlated with steeper losses, a metric that will shape 2026 forecasts once fresh polling arrives. The 2022 midterms defied historical precedent by limiting losses to 13 House seats for Democrats, a performance driven partly by candidate quality and partly by Republican underperformance in swing districts despite national headwinds.

Candidate recruitment will prove critical in 2026. Strong incumbents tend to survive even in poor national environments, while open seats in competitive districts often flip. Retirements from the current Congress—particularly among those who previously flipped their seats from the other party—will create natural vulnerability. Both parties are already quietly assessing retirement intentions, with several cycle-tested members from competitive districts potentially stepping down.

Economic conditions entering 2026 will likely dominate the electoral environment. Inflation, unemployment rates, and wage growth all correlate strongly with House outcomes. If the economy enters recession or experiences significant slowdown, historical models suggest deeper losses for the party holding the presidency. Conversely, strong economic performance can mitigate midterm losses significantly. Housing affordability, a critical issue in high-income suburban districts, will also shape persuadable voter sentiment in key regions.

Special elections before November 2026 could also shift the baseline, serving as early indicators of turnout models. Should vacancies occur in competitive seats, the outcomes and turnout patterns in those elections will provide valuable data for both parties’ strategic planning. The 2024 special elections in New York and other states provided mixed signals but underscored the volatility present in purple districts.

Republicans’ current nine-seat cushion faces measurable exposure, though exact seat counts will hinge on economic perceptions, legislative outcomes, and candidate recruitment still two years out. If Republicans can point to legislative accomplishments and economic gains, they may hold or even expand their majority. Conversely, legislative gridlock, internal party conflict, or economic deterioration could accelerate the historical midterm swing against them. Democrats face the challenge of capitalizing on competitive terrain without assuming that favorable structural conditions guarantee gains.

The next redistricting cycle remains fixed after the 2030 Census, locking the current map through 2032 barring court intervention. This makes the 2026 and 2028 elections particularly consequential—they will determine which party controls the House during what could be a decisive 2030 redistricting. The stakes extend beyond 2026 and shape incentives for both parties in the coming two years.


Sources