
As Donald Trump begins his second non-consecutive term, approval metrics offer a window into how the public is assessing performance amid a deeply divided electorate. These numbers matter not just for day-to-day governance but for how they might shape turnout and coalition strength in future midterms and beyond. The polling data here paints a complicated picture of stability without the traditional post-inauguration lift seen in earlier cycles.
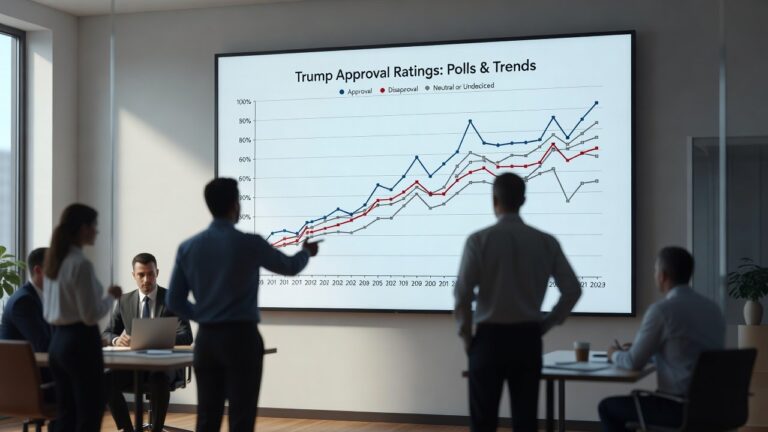
Monthly trends from January through May 2025 show averages holding in the mid-46 percent range, starting at 47.2 percent approval in January before settling around 46.5 percent by May. Disapproval hovered near or above 49 percent throughout. When you model this electorally, that narrow gap between approval and disapproval leaves little margin in battleground states where small shifts among independents or suburban voters can flip electoral votes.
Historical patterns underscore the difference from past transitions. Compared with earlier presidents at the five-month mark, Trump’s 46.4 percent average sits below most predecessors, including Biden’s 53.8 percent in 2021 and Obama’s 63.1 percent in 2009. Second-term baselines for Reagan and Clinton were notably higher. This absence of a pronounced honeymoon aligns with longer-term trends of rising polarization, where voters enter a new term with firmer partisan priors than in the less sorted electorate of earlier decades.
The evolution of Trump’s approval ratings over his political career offers important context. During his first term from 2017 to 2021, his approval never exceeded 49 percent in aggregate polling, and he remained the only president since Truman to leave office with net-negative approval. His post-presidency period saw considerable volatility tied to legal challenges and the January 6 investigation. The stabilization in the mid-46 percent range for his second term suggests a baseline that reflects his core support and opposition without the volatility of earlier periods—a phenomenon political scientists attribute to increased partisan sorting and reduced persuadable voters.
Demographic breakdowns from May 2025 highlight the same divides that have defined recent electoral maps. Republicans registered 88.3 percent approval while Democrats sat at 7.4 percent; independents fell in between at 38.2 percent. Men approved at 51.3 percent versus 42.1 percent for women. White voters showed 52.4 percent approval compared with 12.3 percent among Black voters and 38.6 percent among Hispanics. Age and education followed familiar gradients, with stronger support among those 65 and older and those with lower formal education. When you model this electorally, these patterns map directly onto key swing regions—the Rust Belt’s older White working-class voters versus growing Sun Belt suburbs and urban cores—suggesting limited crossover potential without major shifts in underlying conditions.
The gender gap evident in these numbers reflects broader trends. Women’s approval at 42.1 percent represents a consistent 9-point deficit compared to men, a pattern that has persisted across multiple administrations and appears driven by divergent views on social issues, reproductive rights, and economic priorities. Among college-educated women specifically, approval runs notably lower, registering in the high 30s, while non-college women show somewhat higher support in the mid-40s. This educational divide within demographic groups adds another layer of complexity to electoral targeting and coalition building.
Geographic data reveals approval strengths and vulnerabilities by region. Southern states show the highest approval ratings, with Texas, Florida, and other traditionally Republican strongholds registering in the low-to-mid 50s. Northeastern states register considerably lower, particularly in major metropolitan areas like New York and Pennsylvania’s urban centers. The Midwest presents the tightest race, with approval hovering around 46-48 percent in states like Wisconsin and Michigan—precisely where margins in 2020 proved decisive. These regional patterns suggest that while approval ceilings appear geographically constrained, any movement in approval would disproportionately impact battleground viability.
Policy-specific readings add further texture. Immigration handling drew 48 percent approval, energy policy reached 52 percent, while foreign policy and healthcare lagged at 42 percent and 38 percent respectively. These granular figures often track more closely with voter priorities in particular states than the overall job rating. Breaking this down further, immigration approval varies significantly by region—reaching 55 percent in border states and rural areas while dropping to 42 percent in urban centers. Energy policy strength reflects broad support for deregulation and fossil fuel development among Republicans and rural voters, while healthcare’s weakness reflects longstanding partisan disagreements over healthcare expansion and costs that transcend this administration.
Economic perception represents a crucial variable in Trump approval trends. Historically, presidential approval correlates most strongly with economic indicators in the six-month to two-year window of a term. As of May 2025, unemployment remains near historic lows, though wage growth and inflation remain contentious issues in polling. When asked specifically about personal financial condition, 52 percent of Americans reported satisfaction compared to 45 percent reporting concern. However, this economic sentiment splits sharply by income level—households earning over $100,000 annually show 61 percent satisfaction while those earning under $40,000 register only 38 percent. This disparity suggests that while headline economic numbers support the administration’s messaging, uneven economic gains could represent a ceiling on approval growth.
Several factors appear to have shaped the trajectory so far: economic data releases, executive actions on immigration and trade, media tone, and international developments. The trajectory in the first five months shows remarkable stability despite multiple news cycles that might have been expected to produce movement—a pattern suggesting voters have largely calibrated their approval based on partisan alignment rather than responding significantly to new information. Polling methodology itself warrants caution—averages across multiple firms reduce house effects, yet differences in likely-voter screens, weighting by education, and question wording can still produce 2-to-3-point variations within margins of error.
Looking forward, approval trajectories historically respond to sustained economic shifts, major legislative achievements, or significant external events. Reagan’s approval climbed from 51 percent at six months to the high 50s by year-end, driven by perceived economic recovery. Clinton’s held steady in the low-to-mid 50s throughout his first term despite scandal. The question for Trump’s second term centers on whether sustained policy wins or deteriorating economic conditions might shift the current equilibrium. Given the narrow margins in swing states, even a 2-3 point shift in approval could have meaningful implications for 2026 midterm dynamics and 2028 succession politics.
The role of media consumption patterns cannot be overlooked. Voters who consume primarily conservative media outlets report approval in the 80s, while those relying on mainstream or progressive media sources report approval in the single digits. This 70+ point gap within the electorate—far exceeding any single demographic characteristic—underscores how polarization operates at the information level, making approval ratings themselves interpreted differently across ideological communities.
Taken together, the first five months reflect a polarized baseline that historical election patterns suggest will be difficult to move dramatically without sustained economic improvement or major legislative wins. Demographic and regional fault lines remain consistent with the map that has decided recent presidential contests, leaving approval ceilings and floors largely defined by partisan attachment rather than broad persuasion.