
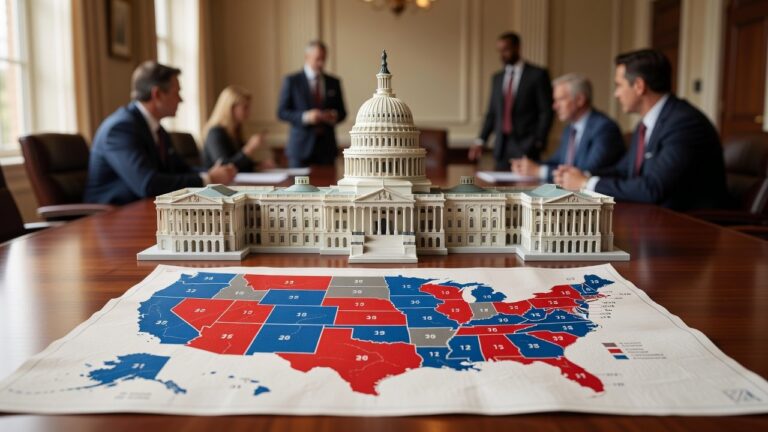

When you model this electorally, the path to 270 votes forces campaigns to prioritize a narrow band of states whose demographic mixes—suburban independents, working-class voters in manufacturing regions, and growing Hispanic populations—can shift outcomes based on turnout models that pollsters refine with likely-voter screens and weighting by education and race. The system itself emerged from Article II compromises that blended population-based House seats with equal Senate representation, yielding 538 total electors today after the 23rd Amendment added three for the District of Columbia.
The framers rejected pure congressional selection or direct popular vote partly to insulate against factionalism, a concern that echoes in modern polling where national popular vote margins often diverge from state-level results. Historical patterns show this tension clearly: the 1800 and 1824 contingent elections in the House, plus the three instances since Reconstruction where candidates prevailed without the national popular vote—Hayes in 1876, Harrison in 1888, and Bush in 2000—highlight how the map rewards efficient geographic distribution over raw totals. The 12th Amendment later required separate ballots for president and vice president, tightening procedures after those early fractures.
Understanding the foundational math behind electoral apportionment helps clarify why certain states dominate campaign calendars. Each state receives a number of electors equal to its total representation in Congress: the number of House members (based on population via the decennial census) plus two senators. This formula means California, with 52 House members and 2 senators, controls 54 electoral votes—roughly 10 percent of the votes needed to win. In contrast, Wyoming, Vermont, and Alaska each have just one House member, giving them the constitutional minimum of three electoral votes. This distribution reflects the founding compromise between large and small states, but it also means that per-capita electoral influence varies dramatically. Wyoming residents exercise roughly 3.6 times the per-capita voting power of Californians when measured by electoral votes per capita, a mathematical reality that shapes both campaign strategy and debates about representational fairness.
Alexander Hamilton’s Federalist No. 68 framing positioned electors as a deliberative check, yet contemporary practice binds them tightly to statewide results in nearly every jurisdiction. Allocation follows the decennial census, so California’s 54 votes contrast sharply with Wyoming’s three, concentrating strategy in battlegrounds where polling methodologies—often blending live calls, online panels, and demographic oversamples—reveal tight margins among white non-college voters and Black turnout cohorts that can decide entire regions.
Most states apply winner-take-all rules, which magnifies small popular-vote edges and explains why resources cluster in Pennsylvania, Michigan, and Georgia rather than safe strongholds. The polling data here paints a complicated picture: repeated surveys across cycles demonstrate how even modest shifts in rural versus metro turnout can flip a state’s entire slate, a dynamic absent in the two states that split electors by congressional district. Maine and Nebraska have occasionally produced divided results, as when Obama captured one Nebraska vote in 2008, underscoring how district-level demographic data can fragment the map.
The winner-take-all system creates a cascading effect that fundamentally shapes campaign priorities. When a candidate wins a state by even a single percentage point, they capture all of that state’s electors. This mechanic means that candidates can theoretically lose the national popular vote by millions while winning the presidency—a scenario that has occurred five times in American history, most recently in 2000 and 2016. Conversely, winning a state by 20 percentage points yields no additional electoral reward compared to winning by one point. This creates powerful incentives for campaigns to ignore demographically safe states entirely. A Democrat commanding 70 percent support in New York receives the same 29 electoral votes as a Democrat winning with 51 percent, while that same candidate struggling in a 48-52 percent race in Arizona faces an all-or-nothing outcome. The result is that roughly three-fourths of the country receives minimal campaign attention in any given election cycle.
Campaign managers rely heavily on historical turnout data and demographic forecasting to identify persuadable voters in swing states. Political scientists have documented that these voters—often called “persuadables” or “moveable middle”—tend to cluster in suburban and exurban areas experiencing demographic transition, particularly collar counties around major metropolitan areas in battleground states. In Pennsylvania, counties like Chester, Bucks, and Delaware have shifted from reliably Republican to highly competitive in recent cycles. In Michigan, counties surrounding Detroit have seen similar trending. Pollsters weight surveys to reflect expected turnout among these populations, though prediction errors in turnout models have repeatedly surprised analysts, as demonstrated in 2016 when models underestimated rural turnout in Midwest states.
The December meeting of electors themselves represents an often-overlooked formal step in the process. While Americans vote on Election Day in November, the actual transfer of power depends on electors meeting in their respective state capitals in December—typically the first Tuesday after the second Wednesday in December—to cast their official ballots. These meetings are ceremonial in most cases, but they provide a final constitutional checkpoint. The electors then send their tallies to Congress, which convenes on January 6 to officially count the votes in a joint session, with the vice president presiding in their role as president of the Senate.
Faithless electors remain statistically rare across ten elections and have never changed a final tally; the Supreme Court’s 2020 ruling upholding state binding laws further reduced their leverage. Certification flows from November’s Tuesday election through December’s state capital meetings and the January 6 joint session, with the 270-vote threshold intact since the current apportionment.
The historical contingent election process, by which the House selects a president when no candidate reaches 270 electors, has not been invoked since 1824, but it remains part of the constitutional design. Should no candidate reach that majority, the House chooses from the top three with each state delegation holding one vote—an arrangement that would require negotiation among state delegations and could theoretically produce outcomes divorced from popular preferences. This scenario becomes more plausible if third-party candidates gain electoral votes in a fragmented election, a concern that influenced strategic voting patterns in elections featuring prominent independent or third-party contenders.
Proposals for a national popular vote compact among states attempt to circumvent constitutional change, yet defenders note the system’s role in preserving federal balance, a point reinforced by historical election data showing how non-competitive states see depressed turnout in demographic subgroups that pollsters track through longitudinal panels. The National Popular Vote Interstate Compact has been adopted by states controlling 209 of the 270 needed electoral votes as of 2024, representing a strategy to ensure that presidents are elected by national popular vote margins without requiring a constitutional amendment.
Key structural facts remain consistent: 538 electors total, minimum three votes for seven states plus the District of Columbia, winner-take-all in 48 states, electors barred from holding federal office, and campaign focus narrowed to roughly a dozen battlegrounds. These mechanics continue to shape both polling interpretation and strategic resource allocation across successive cycles. For voters and observers seeking to understand presidential elections, recognizing these structural features—how census reapportionment shifts electoral power between regions, why certain states consistently attract campaign resources while others are ignored, and how razor-thin margins in a handful of states can determine national outcomes—provides essential context for analyzing both electoral strategy and the broader debate about representational fairness in American democracy.