
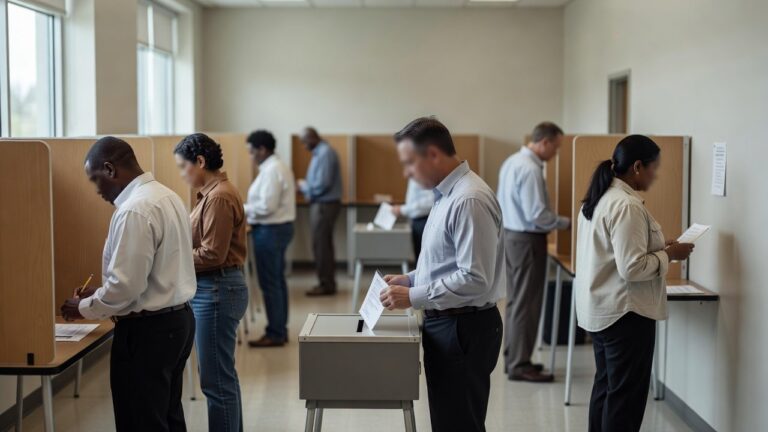
Election polling remains essential for mapping out battleground dynamics and projecting outcomes across the electoral map, yet the recurring shortfalls between survey projections and final results trace back to stubborn methodological constraints rather than overt partisan tilt. These limitations surface most clearly when we examine how samples are built, who responds, and how adjustments are applied—factors that have repeatedly produced surprises in states like Pennsylvania, Michigan, and Georgia over the past three cycles.
When you model this electorally, incomplete sampling frames immediately complicate forecasts because they struggle to capture the full universe of likely voters amid shifting demographics. Older random-digit-dial approaches once covered broader populations, but the move to blended cell-phone, voter-file, and online panels leaves gaps, especially among younger and lower-propensity voters who cluster unevenly across Sun Belt and Rust Belt districts. Address-based and registration-based frames help close some of those holes, but states with aggressive voter-roll maintenance or strict ID rules still show 10-15 percent shortfalls in coverage, hitting transient and minority communities hardest and injecting uncertainty into district-level estimates.
The shift away from landline-heavy surveying reflects genuine changes in American communication patterns, but it has introduced its own set of blind spots. While roughly 85 percent of U.S. adults now carry cell phones, certain segments—particularly older voters and those in rural areas—remain harder to reach through mobile-only strategies. Pollsters who rely too heavily on online panels drawn from opt-in internet communities may systematically exclude populations with limited broadband access or lower digital engagement, skewing results in ways that aren’t always apparent until after Election Day.
Likely-voter screens add another variable that can swing projected margins in close Senate or House races. Models relying on past turnout history versus self-reported interest produce noticeably different results depending on whether emerging blocs in suburban or exurban areas are included or excluded. Historical patterns from 2016 and 2020 demonstrate how these choices can shift toplines by several points in states where education or age cohorts are narrowly divided. A pollster who assumes 2020 turnout levels will reach different conclusions than one who models 2018 midterm participation, and that single methodological choice can flip the direction of a projected margin in competitive races.
The challenge intensifies when pollsters attempt to account for “shy” voters—respondents who support a candidate but hesitate to admit it in surveys due to social desirability bias or fear of judgment. This phenomenon gained renewed attention after 2016 and again in 2020, though empirical evidence suggests its impact varies considerably by region, candidate, and issue salience. Some analysts argue that modern polling’s transparency about methods and reduced stigma around candid responses have diminished shy-voter effects, while others contend that intensifying polarization has made certain voter segments more reluctant to participate honestly in surveys.
The polling data here paints a complicated picture when nonresponse rates dip below 10 percent, as is now common. Respondents with stronger opinions and higher education levels participate at higher rates, while working families and certain ethnic groups do not, creating skews that persist even after standard demographic weighting. Callback studies and incentive experiments confirm that harder-to-reach voters often diverge on economic and candidate-favorability questions, a pattern that has historically tilted aggregates in Rust Belt contests where turnout among non-college voters proved decisive. Research from organizations tracking polling accuracy has found that when a poll achieves a response rate below 5 percent—increasingly typical in the era of caller ID and survey fatigue—the margin of error effectively widens even when statistical adjustments are applied.
Weighting decisions further influence the map because they must balance variables like age, race, education, and region against Census benchmarks. Over-weighting small cells increases variance, while missing interactions with urban density or income leaves residual bias. Multilevel regression and post-stratification techniques offer finer granularity, yet modest changes in targets can still move state margins by one to three points—enough to alter Electoral College or chamber-control scenarios when several battlegrounds sit within that range. The 2020 Census redistricting cycle added another layer of complexity, as pollsters had to recalibrate their demographic targets based on updated population estimates while contending with significant shifts in regional demographics that weren’t fully captured until years later.
One underappreciated factor in polling methodology involves the treatment of voters who refuse to declare a party affiliation. The growth of independent voters presents real sampling challenges, as partisan-based turnout models struggle to forecast their behavior. Some pollsters weight independents based on historical voting patterns, while others employ separate modeling approaches. This divergence in handling unaffiliated voters has produced notably different results in swing states where independents represent 30 percent or more of the electorate, yet no consensus methodology has emerged across the industry.
Mode effects from the shift to online, text, and interactive voice surveys introduce additional measurement differences, particularly on enthusiasm and third-party support questions. Parallel calibration tests show consistent but modest divergences that matter most in polarized districts where small shifts in reported intensity can affect turnout models. A respondent completing a survey on a smartphone may answer differently than one on a desktop computer, and someone text-responding to a survey prompt may display different patterns than one engaging with a live interviewer. These mode effects are rarely publicized but accumulate across a polling season, potentially creating systematic bias in aggregated forecasts.
Newer addressable panels and passive data collection promise efficiency but risk widening coverage gaps among populations less active on digital platforms, a concern that echoes coverage shortfalls seen in earlier cycles. Some firms now experiment with combining traditional survey data with administrative records—voter history, registration data, and consumer information—to construct more sophisticated models of likely voters. While these approaches can improve accuracy, they also raise questions about privacy and the extent to which behavioral data should inform electoral projections.
The practice of “herding” in published polls—where organizations avoid releasing outlier results that diverge too far from consensus—adds another layer of distortion to the polling ecosystem. Pollsters face reputational pressure to avoid being dramatically wrong compared to peers, creating incentives to stay within established ranges even when their underlying data suggests otherwise. This dynamic can suppress the true range of uncertainty and make aggregate polls appear more confident than circumstances warrant.
Independent evaluations of pollster performance across multiple elections highlight the value of transparency on frames, weighting, and mode adjustments. Aggregators that account for house effects and historical accuracy deliver more stable averages, though even leading organizations can miss when turnout assumptions shift unexpectedly. Organizations like the American Association for Public Opinion Research (AAPOR) publish post-election analyses examining which firms performed well and why, yet these lessons aren’t always incorporated quickly into industry practice. Continued experimentation with real-time diagnostics and response-quality tracking remains the most direct route to tightening uncertainty ranges around state-by-state projections. Ultimately, recognizing polling’s inherent limitations while understanding the specific methodologies behind particular forecasts allows observers to consume electoral data more critically and prepare for the inevitable moments when polls diverge from outcomes.
Sources
- Reuters Politics – Breaking news and in-depth coverage of U.S. political campaigns and elections
- AP News Elections – Associated Press election coverage and polling analysis
- NPR Politics – National Public Radio’s political reporting and polling methodology explainers
- Politico Polls – Comprehensive polling data and accuracy analysis
- Pew Research Center Fact Tank – Research on polling methodology and election accuracy